Dashboard
Your financial command center. See your budget status, income, expenses, and wallet balances at a glance, with quick actions to add expenses in one tap. You can show or hide individual sections from Settings → Dashboard Widgets.
Overview
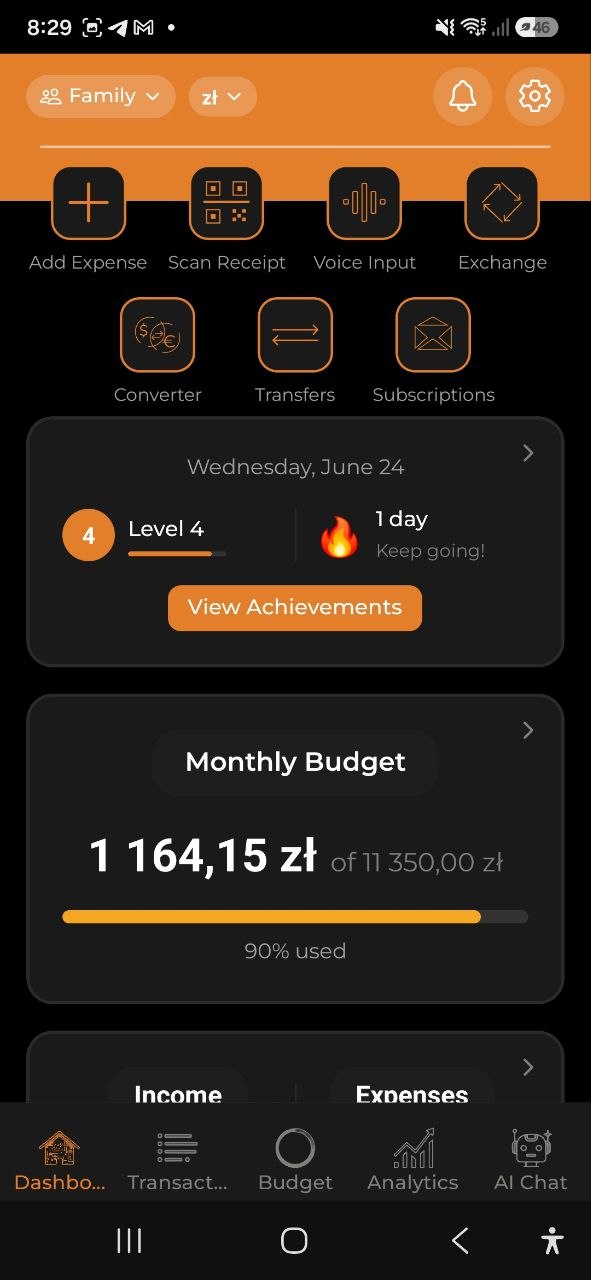
The Dashboard is the first screen you see after logging in. It displays your current account context and key financial metrics for the current month.
Account Switcher
At the top-left corner, tap the account name (e.g., Family) to open the Switch Account dropdown. You can switch between your Personal, Shared, and Business accounts. All data on the Dashboard updates to reflect the selected account.
Next to the account name there is a separate currency pill (e.g., zł) — tap it to instantly change the display currency.
Quick Actions
The quick actions below the header are a grid of one-tap shortcuts to the most common tasks. When there are more actions than fit on one row, they wrap onto the next row so every action stays visible.
Available actions:
| Action | What it does |
|---|---|
| Add Expense | Opens the manual expense form |
| Scan Receipt | Opens the camera to photograph a receipt for AI extraction |
| Voice Expense | Speak your expense naturally |
| Voice Income | Speak your income naturally (hidden by default) |
| Scan Invoice | Photograph an invoice to record income (hidden by default) |
| Exchange | Opens the currency exchange form |
| Converter | Opens the currency converter |
| Transfers | Opens the wallet transfer form |
You can customize this strip: go to Settings → Dashboard Widgets, open the Quick actions section, toggle any action on or off, and drag the handles to reorder them. Voice Income and Scan Invoice are hidden by default — turn them on there if you track income by voice or invoice scan.
Financial Health Score
The Financial Health Score widget shows a single 0–100 score summarizing your overall financial health for the current month:
- Green (70–100) — finances are in great shape
- Yellow (40–69) — some areas need attention
- Red (0–39) — significant issues detected
The circular gauge in the top-right of the card fills proportionally to your score. Tap the card to open a breakdown sheet showing four components:
| Component | Max pts | Description |
|---|---|---|
| Budget adherence | 25 | % of active budgets not exceeding their limit |
| Savings rate | 25 | Maps your monthly savings % linearly (0% → 0 pts, 20%+ → 25 pts) |
| Goal progress | 25 | % of active savings goals on track toward their deadline |
| Debt health | 25 | Deducted proportionally for overdue debts |
“Not enough data” appears when fewer than two components have data (e.g., a brand-new account with no budgets, goals, debts, or income yet).
The score is computed entirely on-device — no internet connection or AI calls required.
Gamification Widget
Below the quick actions, a compact card shows your gamification progress:
- Level — your current level with an XP progress bar toward the next level
- Streak — your daily tracking streak count with a fire or snowflake emoji
Tap this card to open the full Achievements screen with all badges, streak details, and category filters.
See Achievements & Gamification for details on how XP, levels, and achievements work.
Monthly Budget Card
- Shows your current spending against your monthly budget (e.g., 2 846,83 zl of 20 000,00 zl)
- Color-coded progress bar: green (under control), yellow (approaching limit), red/orange (near or over budget)
- Displays percentage used (e.g., 86% used)
- Tap the card to navigate to the Budgets tab for details
Note: If no monthly budget is set, you’ll see a hint to create one.
Income & Expenses
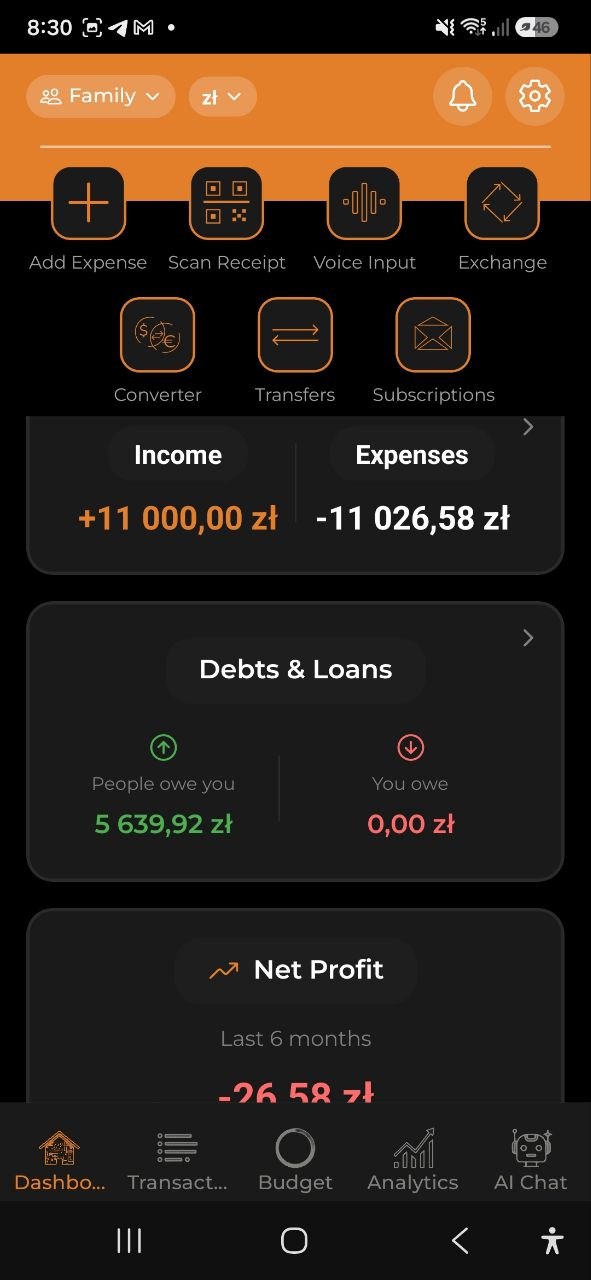
A combined card showing your monthly totals side by side:
- Income (left, green) — your total income for the current month (e.g., +$2,482.52). Tap to go to the Transactions tab (Income view)
- Expenses (right) — your total expenses for the current month (e.g., -$4,838.99). Tap to go to the Transactions tab (Expenses view)
Net Profit
Below the income and expenses cards, the Net Profit widget shows how much money you actually saved or lost this month, and tracks the trend over the last 6 months as a line chart:
- Current month net profit — displayed above the chart in green (positive) or red (negative)
- 6-month trend — a line chart showing monthly net profit (income − expenses) for the past 6 months
- Tap a data point on the chart to see the exact value for that month
Formula: Net Profit = Total Income − Total Expenses (both converted to your base currency)
Net Capital
The Net Capital widget shows your total net worth across all wallet currencies, converted to your base currency:
- Total net capital — sum of all wallet balances converted to your settings currency, shown in green (positive) or red (negative)
- Per-currency breakdown — each currency’s current balance listed below the total
Note: Net Capital only appears after you set your initial wallet balances. See Wallet & Exchange to configure them.
Fat Finder Card
Below the debts section, the Fat Finder card shows a summary of your monthly expense audit:
- Total potential savings — how much you could save per month
- Top 3 findings — quick list with severity dots and savings amounts
- View Full Report — tap to open the detailed Fat Finder screen
This card requires a Pro or Business subscription. Free plan users see an upgrade prompt.
See Fat Finder for the full feature guide.
Calendar
The Calendar widget shows a monthly calendar grid with colored dots indicating days with transactions:
- Green dot — income recorded on that day
- Red dot — expense recorded on that day
- Today is highlighted with an orange circle
- Month navigation — use left/right arrows to switch between months
Below the calendar grid, a summary row shows:
- Income — total income for the selected month (converted to your base currency)
- Expenses — total expenses for the selected month
- Net Profit — income minus expenses, green if positive, red if negative
Tap Tap to view details to open the full Calendar screen with three tabs:
| Tab | Content |
|---|---|
| Categories | Income and expense breakdowns by category — each row shows category icon, name, percentage, and amount. Net profit displayed at the bottom |
| Wallets | Current balance for each currency wallet with percentage of total |
| Transactions | Chronological list of all transactions for the month. Tap a day on the calendar to filter to that specific day; tap again to deselect |
Tip: All amounts in the Calendar are automatically converted to your base currency, so you can see accurate totals even across multiple currencies.
Wallet Balances
- Horizontal scrollable cards showing your balance in each currency (e.g., EUR 16,723.00, PLN 2 192,89, USD $56…)
- Tap See All to go to the full Wallet view with detailed breakdowns
- If no balances are set, you’ll see a prompt to add your initial balance
Pull to Refresh
Pull down anywhere on the Dashboard to refresh all data and sync with the server.
FAQ
-
Q: Why does the Dashboard show $0 for everything? A: You haven’t added any expenses or income yet. Use the quick action buttons to add your first transaction.
-
Q: Can I customize what appears on the Dashboard? A: Yes. Go to Settings → Dashboard Widgets and toggle individual sections on or off. Your preferences are saved and persist across restarts. You can also drag widgets to reorder them. The quick-action strip is customizable the same way — open the Quick actions section in Settings → Dashboard Widgets to show, hide, or reorder its buttons.
See also: Expenses & Income | Wallet & Exchange | Fat Finder | Analytics